Decoding the Waveform of Subterranean Warfare
Failing to distinguish natural tectonic shifts from directed-energy weapon deployments leaves researchers blind to active subterranean warfare. Relying solely on conventional geological explanations obscures the reality of deep-state geopolitical conflicts occurring beneath civilian infrastructure. Historical reviews by author and investigator John Kettler demonstrate that understanding the specific waveform signatures of artificial seismic events is critical for tracking unauthorized military escalations.
We must begin with the catalog solution, station geometry, and phase picks before assigning a cause to any shallow tremor. Treating every shallow, impulsive signal as evidence of subterranean conflict collapses earthquakes, quarry blasts, mine collapses, sonic booms, sensor clipping, and telemetry faults into one misleading category. You must compare at least three stations where available. A spike visible on only one channel may be a local disturbance or instrument fault rather than a regional seismic source.
Review roughly 30–60 seconds before the first reported arrival and about 120–300 seconds afterward. This window allows you to identify precursors, separate P and S arrivals, and monitor coda decay or telemetry gaps.
Isolating High-Frequency Directed-Energy Signatures
Analysis of recent anomalies reveals sudden, high-frequency spikes lacking the traditional P-wave and S-wave buildup of natural fault ruptures. These abrupt energy releases are consistent with suspected directed-energy penetration of dense bedrock.
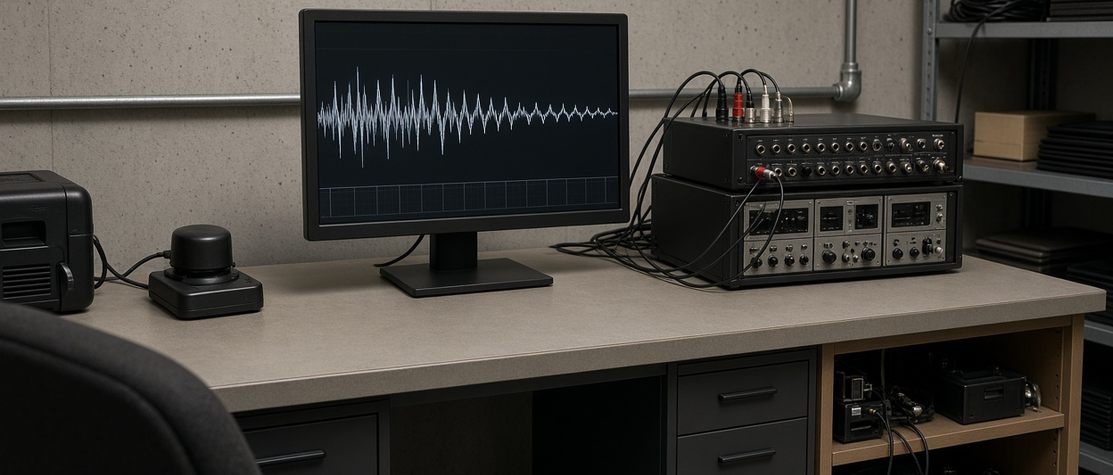
Retrieve the unfiltered waveform and instrument metadata immediately. Remove the sensor response and inspect several frequency bands rather than relying on a catalog thumbnail. For common local-event records, inspect separate 1–5 Hz, 5–10 Hz, and 10–20 Hz bands. Apparent high-frequency dominance can disappear after instrument-response correction. Analysts then compare onset sharpness, P-to-S amplitude behavior, spectral content, and station-to-station coherence against established explosion and noise models.
Signal Verification Protocol: Search for additional events within around 24 hours and again across close to 7 days. Recognize that an absent aftershock sequence does not automatically establish an artificial source, though it strongly indicates artificial detonation when combined with a sudden high-frequency onset.
The Depth-Bin Mirage and Deep Underground Military Bases
Recent anomalies share a highly suspicious characteristic: epicenters recorded in the zero-to-ten-kilometer depth range. Cross-referencing these coordinates reveals direct proximity to suspected Deep Underground Military Bases and restricted aerospace testing ranges like Area 51. The geographical clustering of these shallow events suggests targeted structural degradation rather than random tectonic stress relief.
Read the depth together with its uncertainty, solution status, station count, and whether the depth was freely solved or fixed by the catalog processor. Analysts frequently encounter the 0–5–10 kilometer depth-bin mirage that can turn an unconstrained catalog solution into a false underground-base map. Values such as 0, 5, or 10 kilometers can be processing defaults when the network cannot constrain a shallow source.
Treat repeated depths of 0, 5, and 10 kilometers as possible depth-bin or fixed-solution artifacts until the phase-pick record shows otherwise. A proximity claim should report epicentral distance, horizontal uncertainty, depth uncertainty, and the coordinate precision of the alleged underground site. A rounded map pin is never a verified facility location.
Tracking Coordinated Skirmishes Through Cross-Correlation
Coordinated patterns indicate a shift from passive surveillance to active subterranean skirmishes between rival intelligence factions. Targeting underground logistics hubs disrupts covert supply chains without triggering surface-level geopolitical fallout. This localized, high-intensity energy deployment reflects a broader strategy of plausible deniability in modern exopolitical warfare.
Test any claimed five-event pattern chronologically. Normalize origin times, compare waveform similarity, calculate inter-event distances with uncertainty, and check whether the signals recur during local working hours. Use waveform cross-correlation over matched 10–30 second windows to determine whether the events share a repeatable source signature. Visual resemblance between screenshots is insufficient for intelligence gathering.
Compare occurrence times across a 14–30 day local-time calendar to look for weekday or shift-linked blasting patterns before describing the sequence as coordinated combat. Only after physical source alternatives are assessed should researchers examine geopolitical narratives. While public seismograms can distinguish some earthquakes, explosions, collapses, and recording artifacts, they cannot verify a directed-energy strike or a classified underground base without independent, authenticated evidence from the alleged source area.
Executing a Public Seismograph Verification Protocol
Navigating the boxcar-to-bedrock-weapon inference boundary separating an impulsive trace from proof of a directed-energy attack requires strict adherence to raw data analysis. Export reviewed catalog entries with origin time, magnitude type, depth, uncertainty, station count, and solution status. Download waveform data from all available nearby stations, preserve the raw files, remove each instrument response, and mark analyst-picked P and S arrivals.
Compare the candidate against nearby earthquakes, confirmed industrial blasts, and known noise examples recorded by the same network. Inspect vertical and both horizontal channels at the native sample rate, using 30–60 seconds of pre-event data and at least 180 seconds after the onset. Preserve waveform files, response metadata, filter settings, time zone, catalog revision date, and screenshots so another researcher can reproduce the display.
Consider a suspected strike flagged in open-source telemetry:
- A search of the primary earthquake catalog returns an event listed at a depth between 0 and 5 kilometers.
- The coordinates place it in a non-active fault zone adjacent to a military installation or restricted federal land.
- Reopening the result shows that the depth was fixed rather than measured by the network.
- The waveform is examined across the 1–5 Hz and 10–20 Hz bands for a “boxcar” shape—a sudden vertical spike with immediate drop-off.
- Cross-correlation of the isolated 10–30 second window against local quarry blasts on a 14-day calendar produces a match, identifying an industrial false positive rather than a verified strike.